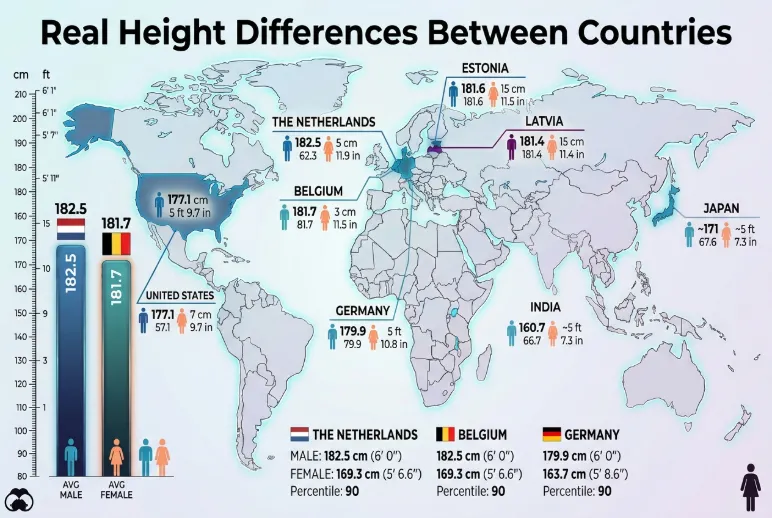
Why are some countries taller than others, and what do those height difference really look like?
The Tallest Countries in the World: Looking Beyond the Rankings
When people search for the tallest countries in the world, they usually expect a numbered list. While rankings are interesting, they only tell part of the story.
A difference of 2 or 3 centimeters can change the order of countries, yet it has little practical meaning in everyday life. More importantly, rankings change depending on:
- the year participants were born,
- whether the data represent adults or adolescents,
- the survey methodology,
- and the statistical model used.
That is why reputable researchers focus less on who ranks first and more on population trends.
The NCD Risk Factor Collaboration (NCD-RisC) consistently shows that Northern and parts of Central Europe have the tallest average adult populations, while many countries in South and Southeast Asia have lower average heights. These height differences have remained relatively stable over recent decades, although many countries continue to gain height as childhood health and nutrition improve.
Average Male Height Around the World
The table below uses estimates derived from the NCD-RisC dataset for adults born in 1996. These figures should be interpreted as population averages, not maximum or ideal heights.
| Country | Average Male Height | Approx. Imperial | Global Pattern |
|---|---|---|---|
| Netherlands | 182.5 cm | 5 ft 11.9 in | Among the world’s tallest populations |
| Belgium | 181.7 cm | 5 ft 11.5 in | Consistently above global average |
| Estonia | 181.6 cm | 5 ft 11.5 in | Very tall population |
| Latvia | 181.4 cm | 5 ft 11.4 in | Northern European trend |
| Denmark | 181.4 cm | 5 ft 11.4 in | Stable for several decades |
| Germany | 179.9 cm | 5 ft 10.8 in | Above global average |
| United States | 177.1 cm | 5 ft 9.7 in | Above global average |
| Japan | ~171 cm | ~5 ft 7.3 in | Significant gains during the 20th century |
| India | ~166 cm | ~5 ft 5.4 in | Continued gradual improvement |
Values are rounded for readability. Exact estimates vary slightly depending on the birth cohort and statistical model used.
One Centimeter Doesn’t Change Everyday Life
It is tempting to compare countries as though they were competing in a race.
For example:
| Country | Difference from Netherlands |
|---|---|
| Belgium | ~0.8 cm shorter |
| Estonia | ~0.9 cm shorter |
| Denmark | ~1.1 cm shorter |
From a scientific perspective, these populations are remarkably similar.
A person visiting Amsterdam is unlikely to notice a meaningful difference compared with Copenhagen or Tallinn because average heights differ by less than the width of a finger.
The larger contrasts appear when comparing populations separated by 10–20 centimeters, not one or two.
Average Female Height Shows Similar Patterns
Women follow many of the same regional trends observed in men, although the rankings are not identical.
Northern Europe again dominates the upper end of the distribution.
| Country | Average Female Height | Approx. Imperial |
|---|---|---|
| Netherlands | ~169.8–170.4 cm | ~5 ft 7 in |
| Latvia | ~169 cm | ~5 ft 6.5 in |
| Estonia | ~168.7 cm | ~5 ft 6.4 in |
| Denmark | ~169.5 cm | ~5 ft 6.7 in |
| Czech Republic | ~168 cm | ~5 ft 6.1 in |
Although average female height is lower than average male height in every country, the geographical pattern is strikingly similar, suggesting that environmental influences affect both sexes in comparable ways.
What Does a 17 cm Difference Actually Look Like?
Statistics become much more meaningful when translated into everyday experience.
Consider this comparison.
| Country | Average Male Height |
|---|---|
| Netherlands | 182.5 cm |
| India | ~166 cm |
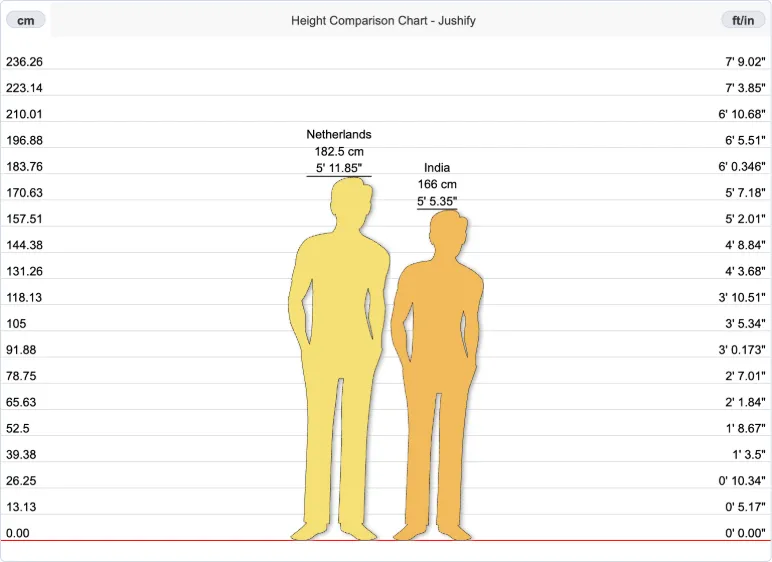
The numerical difference is approximately 16–17 centimeters.
But how noticeable is that?
In real life:
- Eye level shifts significantly.
- Shoulder height becomes noticeably different.
- Group photographs create a visible contrast.
- Clothing proportions often differ.
Most people can easily distinguish a height difference of around 15 centimeters when two adults stand next to each other.
This is exactly where a Height Comparison Tool becomes more informative than numbers alone.
Instead of imagining the difference, readers can visualize two accurately scaled silhouettes standing side by side.
Height Difference is About Distributions—Not Individuals
One of the biggest mistakes people make is assuming national averages describe every individual.
They do not.
Imagine two countries:
| Country | Average Height |
|---|---|
| Country A | 182 cm |
| Country B | 170 cm |
This does not mean every person from Country A is taller than every person from Country B.
In reality, height follows a distribution.
Many people from Country B will be taller than the average person from Country A, and many people from Country A will be shorter than their own national average.
Population averages help us understand broad trends—not predict the height of individuals.
This distinction is fundamental in epidemiology and population science and is often overlooked in popular discussions.
How Much Have Countries Changed Over the Last Century?
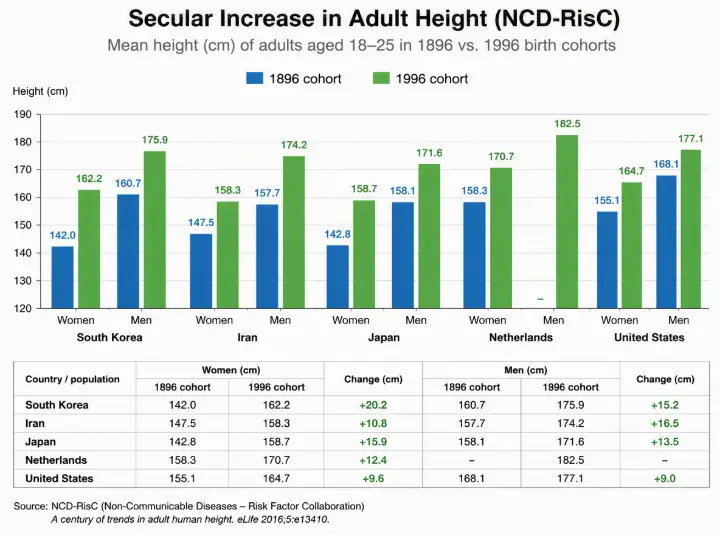
One of the most fascinating discoveries from the NCD-RisC study is that people today are generally taller than their great-grandparents.
However, the pace of change has not been the same everywhere.
Some countries experienced dramatic increases, while others changed relatively little.
Countries with Some of the Largest Increases in Average Height
| Country | Notable Trend | Likely Contributing Factors |
|---|---|---|
| South Korea | One of the largest gains in women | Improved nutrition, healthcare, economic development |
| Iran | Large increase in men | Public health improvements, better childhood nutrition |
| Japan | Strong gains after World War II | Rapid economic growth, healthcare, food availability |
| Portugal | Significant increase | Improved living standards |
| Greece | Steady increase | Nutrition and healthcare improvements |
For example, South Korean women experienced an increase of more than 20 cm between birth cohorts born in 1896 and 1996—one of the largest recorded improvements in the world.
Likewise, Iranian men gained more than 16 cm across the same century-long comparison, illustrating how quickly population height can change when childhood conditions improve.
Why Do People From Some Countries Grow Taller?
If two healthy babies are born on the same day in different countries, will they grow to exactly the same height?
The answer is not necessarily.
Scientists have spent decades studying why populations differ in average stature, and one conclusion is remarkably consistent: there is no single explanation.
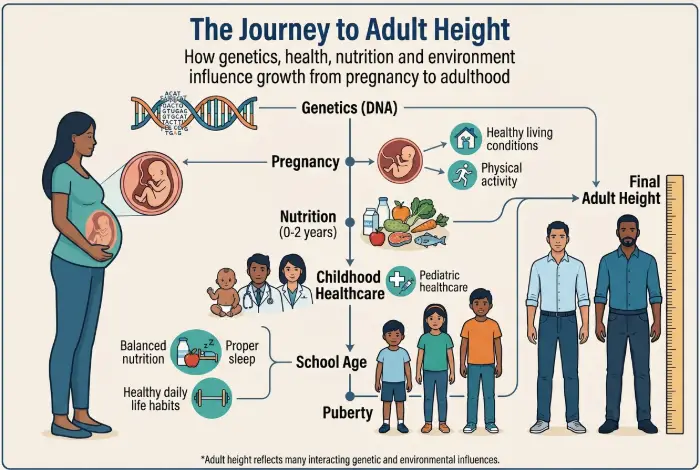
Adult height is the result of thousands of small biological and environmental influences acting together over nearly two decades of growth.
Rather than asking “Which factor matters most?”, researchers now ask “How do these factors interact?”
The answer involves genetics, nutrition, healthcare, disease burden, living conditions, maternal health, and even historical events.
Genetics: The Blueprint, Not the Finished Building
One of the most misunderstood topics in human biology is the role of genetics.
People often hear that height is “80% genetic” and conclude that nutrition or healthcare hardly matter.
That interpretation is incorrect.
Height is what scientists call a polygenic trait, meaning it is influenced by thousands of genetic variants spread throughout the human genome rather than a single “height gene.”
Large genome-wide association studies have identified more than 12,000 genetic variants associated with adult height, each contributing only a tiny effect. Together, these variants influence how bones grow, how growth hormones function, and how cartilage develops. Yet genetics alone cannot explain why average height has changed so dramatically in many countries over just a few generations. Evolution does not happen that quickly.
Instead, genetics defines the range of possible height for an individual, while environmental conditions determine how much of that potential is achieved.
Genetics vs. Growth Potential
| Concept | What It Means | Can It Change During Your Lifetime? |
|---|---|---|
| Genetic Potential | The inherited range your body could reach under healthy conditions | No |
| Childhood Nutrition | Supplies energy and nutrients needed for growth | Yes |
| Disease Burden | Chronic illness can reduce growth | Yes |
| Prenatal Health | Influences fetal growth before birth | Yes |
| Healthcare Access | Helps children stay healthy during development | Yes |
Imagine two children with similar genetic potential.
One grows up with balanced nutrition, vaccinations, safe drinking water, and regular healthcare.
The other experiences repeated infections, poor nutrition, and limited medical care.
Even with comparable genes, their adult heights may differ substantially.
This is why scientists no longer debate genetics versus environment. They study how genetics and environment work together.
Why Childhood Nutrition Matters So Much
The human body does not grow at a constant rate.
Growth accelerates during several critical periods:
- Before birth
- The first two years of life
- Early childhood
- Puberty
If nutrition is inadequate during these windows, some of the lost growth may never be fully recovered.
The World Health Organization identifies early childhood nutrition as one of the most important determinants of healthy physical development. Protein, calcium, zinc, iodine, vitamin D, and many other nutrients all contribute to normal bone growth, muscle development, and hormone production.
However, focusing on one “magic food” oversimplifies the science.
Healthy growth depends on the overall quality of the diet, not a single ingredient.
Nutrients That Support Healthy Growth
| Nutrient | Primary Function | Common Food Sources |
|---|---|---|
| Protein | Builds muscles, tissues, and enzymes | Fish, eggs, dairy, beans |
| Calcium | Bone mineralization | Milk, yogurt, leafy vegetables |
| Vitamin D | Helps absorb calcium | Sunlight, fortified foods, oily fish |
| Zinc | Supports cell growth and immune function | Meat, legumes, seeds |
| Iron | Carries oxygen to growing tissues | Red meat, beans, spinach |
| Iodine | Supports thyroid hormones involved in growth | Seafood, iodized salt |
No single food guarantees greater height. Instead, long-term dietary quality determines whether children receive the nutrients needed throughout their development.
Disease Can Slow Growth
Nutrition is only one side of the equation.
Children also need to remain healthy enough to use those nutrients for growth.
When the body is fighting repeated infections, it redirects energy toward the immune system instead of bone and muscle development.
Historically, diseases such as intestinal infections, parasitic illnesses, and chronic respiratory infections contributed to reduced growth in many parts of the world.
Modern vaccination programs, antibiotics, improved sanitation, and access to clean water have dramatically reduced these burdens in many countries.
This is one reason why average height increased alongside improvements in public health during the twentieth century.
How Disease Influences Growth
| Childhood Condition | Potential Effect on Growth |
|---|---|
| Chronic infections | Reduced energy available for growth |
| Repeated diarrhea | Poor nutrient absorption |
| Intestinal parasites | Reduced nutrient availability |
| Severe malnutrition | Stunted growth |
| Limited healthcare | Delayed treatment of growth-related conditions |
These effects are most pronounced during infancy and childhood, when growth is fastest.
Why Maternal Health Shapes Adult Height
Height does not begin at birth.
It begins long before.
A child’s growth is influenced by maternal health throughout pregnancy.
Researchers have shown that healthy pregnancies are associated with better birth outcomes, while poor maternal nutrition, smoking, certain infections, and inadequate prenatal care can affect fetal growth.
Healthy fetal development provides the foundation for healthy childhood growth.
This explains why public health initiatives focusing on maternal nutrition often improve population health across future generations.
Can Economic Growth Make People Taller?
Economic development influences height, but only indirectly.
Money itself does not increase height.
Instead, economic growth often improves:
- food availability,
- healthcare systems,
- sanitation,
- education,
- maternal care,
- and childhood living conditions.
Together, these improvements create environments where children are more likely to reach their inherited growth potential.
However, wealth alone does not guarantee taller populations.
Several countries with very high incomes are not among the tallest, while some Balkan countries consistently rank near the top despite having lower GDP per capita than many Western European nations.
This reminds us that height reflects decades of cumulative biological and social influences, not income alone.
Factors Influencing National Height
| Factor | Direct or Indirect Influence | Scientific Evidence |
|---|---|---|
| Genetics | Direct | Very strong |
| Childhood nutrition | Direct | Very strong |
| Maternal health | Direct | Strong |
| Healthcare access | Indirect | Strong |
| Sanitation | Indirect | Strong |
| Education | Indirect | Moderate |
| Household income | Indirect | Moderate |
| Food security | Indirect | Strong |
Why Height Increased So Rapidly During the Twentieth Century
One of the most remarkable findings from global height research is how quickly populations changed.
Evolution cannot explain increases of 10–20 centimeters in just three or four generations.
Instead, researchers point to dramatic improvements in:
- childhood nutrition,
- vaccination,
- antibiotics,
- prenatal care,
- sanitation,
- education,
- and economic stability.
South Korea provides one of the clearest examples.
Girls born near the beginning of the twentieth century were among the shortest in the world. By the end of the century, average height had increased by more than 20 centimeters—one of the largest gains ever documented in a national population.
This transformation occurred alongside rapid improvements in healthcare, education, and nutrition.
The lesson is clear:
Human height is remarkably responsive to environmental improvements when those improvements occur during childhood.
Understanding National Height Averages Correctly
One of the easiest mistakes to make is assuming that a country’s average height describes every individual who lives there.
It doesn’t.
An average is simply the midpoint of a much larger distribution.
For example, if the average adult male height in one country is 183 cm (6 ft) and another country’s average is 166 cm (5 ft 5 in), this does not mean every person from the first country is taller than every person from the second.
There will always be overlap.
Some individuals from countries with lower averages will be taller than many individuals from countries with higher averages. Genetics, family background, nutrition, health during childhood, and countless individual factors all contribute to personal height.
The chart below illustrates this concept.
| Scenario | Reality |
|---|---|
| Country A has a higher average height than Country B | ✔ True |
| Every individual in Country A is taller than every individual in Country B | ✘ False |
| Average height predicts an individual’s exact height | ✘ False |
| Average height reflects population-level trends | ✔ True |
Understanding this distinction is essential when interpreting global height statistics.
Why Visual Comparisons Make Height Easier to Understand
Numbers are useful, but people naturally understand visuals much faster than measurements.
Consider these two statements:
- The average adult male in the Netherlands is approximately 182.5 cm tall.
- The average adult male in India is approximately 166 cm tall.
Most readers can calculate that the difference is about 16.5 cm, but very few can immediately picture what that looks like.
Now imagine two accurately scaled silhouettes standing side by side.
Without doing any calculations, you instantly notice:
- the difference in eye level,
- shoulder alignment,
- overall body proportions,
- and how much taller one person appears.
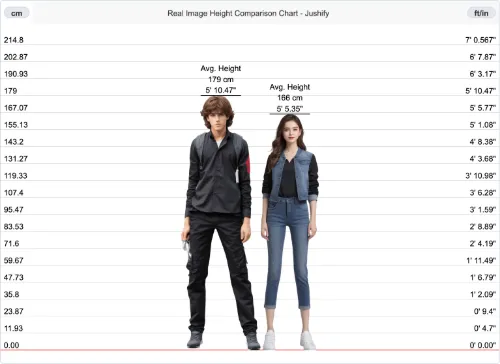
This is where a Height Comparison Chart becomes much more useful than reading statistics alone.
Instead of memorizing numbers, readers can visually compare:
- people from different countries,
- athletes,
- historical figures,
- celebrities,
- family members,
- fictional characters,
- and even everyday objects.
Visualization transforms abstract measurements into something people immediately understand.
Compare Average Heights Around the World
What Height Difference Tells Us About Human Development
Average height is not simply a number on a chart.
It tells the story of generations.
Every centimeter represents decades of change in:
- nutrition,
- healthcare,
- maternal health,
- childhood disease prevention,
- education,
- sanitation,
- and living conditions.
The remarkable increase in average height observed in countries such as South Korea demonstrates that human growth responds quickly when childhood conditions improve.
At the same time, the relatively stable heights seen in several Northern European countries suggest that many populations have already reached or come close to their genetic growth potential under current living conditions.
This perspective shifts the conversation away from asking:
“Which country has the tallest people?”
toward a more meaningful question:
“What can population height teach us about human health, development, and society?”
That is why height research remains an important field within epidemiology, anthropology, economics, and public health.
Key Takeaways
- Height difference between countries is real and well documented by large-scale scientific research.
- Genetics influence height potential, but environmental factors determine how much of that potential is achieved.
- Nutrition, healthcare, sanitation, maternal health, and childhood disease prevention all play major roles.
- Average height has increased significantly in many countries over the past century because of improvements in living conditions.
- Population averages describe trends, not individual people.
- Visual comparisons help readers understand height difference far more effectively than numbers alone.
- The Height Comparison Chart allows anyone to explore these differences in an intuitive and engaging way.
Frequently Asked Questions
According to the NCD Risk Factor Collaboration (NCD-RisC), the Netherlands consistently ranks among the countries with the tallest average adult men, while Northern European countries generally dominate the top positions for both men and women. Rankings may vary slightly depending on the dataset and birth cohort analyzed.
Researchers believe the Netherlands’ exceptional average height results from a combination of genetics, excellent childhood nutrition, high-quality healthcare, favourable living conditions, and long-term public health improvements. No single factor fully explains their height.
Once the growth plates in the bones have closed, significant natural increases in skeletal height are not possible. Good posture may improve the appearance of height, but it does not increase bone length.
Many countries experienced substantial increases in average height during the twentieth century due to improvements in healthcare, nutrition, sanitation, and childhood living conditions. However, height gains have slowed in several countries that are believed to have reached much of their genetic growth potential.
Height difference is influenced by biological factors, including hormones and patterns of skeletal development. Across all populations studied, adult men are taller on average than adult women, although the size of this difference varies slightly between countries.
Conclusion
Human height is one of the most fascinating indicators of how biology and environment interact over time.
The differences observed between countries are not random. They reflect centuries of genetic inheritance combined with decades of improvements in nutrition, healthcare, sanitation, education, and public health. Every generation carries the biological imprint of the conditions in which it grew.
Modern research has transformed our understanding of these patterns. Thanks to global collaborations involving millions of measured participants, we now know that population height is far more than a physical characteristic—it is a window into childhood development, health, and social progress.
Yet statistics alone tell only part of the story.
Seeing two average-height individuals from different countries standing side by side creates an understanding that numbers cannot. That’s why Jushify offers visual tools that have become increasingly valuable for educators, students, researchers, and anyone curious about human growth.
Whether you’re exploring global trends, comparing athletes, or simply satisfying your curiosity, combining reliable scientific data with accurate visualization offers the clearest way to understand how height varies across the world.
References
- Bentham, J., Di Cesare, M., Bilano, V., et al. (2016). A century of trends in adult human height. eLife, 5:e13410. https://doi.org/10.7554/eLife.13410
- NCD Risk Factor Collaboration (NCD-RisC). (2016). Global trends in adult height from 1896 to 1996.
- NCD Risk Factor Collaboration (NCD-RisC). (2020). Height and body-mass index trajectories of school-aged children and adolescents. The Lancet.
- World Health Organization. (WHO). Child Growth Standards. https://www.who.int/tools/child-growth-standards
- World Health Organization. (WHO). Growth Reference Data for 5–19 Years. https://www.who.int/tools/growth-reference-data-for-5to19-years
- Our World in Data. Human Height. https://ourworldindata.org/human-height
- Silventoinen, K. (2003). Determinants of variation in adult body height. Journal of Biosocial Science, 35(2), 263–285.
- Yengo, L., et al. (2022). A saturated map of common genetic variants associated with human height. Nature, 610, 704–712.
- UNICEF. The State of the World’s Children. https://www.unicef.org/reports
- Food and Agriculture Organization (FAO). The State of Food Security and Nutrition in the World. https://www.fao.org/publications