Jushify Tutorial: From Novice to Pro
Welcome to our learning hub, the home of all Jushify tutorial. We designed these detailed, step-by-step guides to walk you through the most creative and practical uses of our tools. In short, each guide will show you not only what to do but also why each step is important, ultimately helping you achieve the best possible results.
Tutorial 1: Creating a Custom Group Comparison (Person to Person)
Goal: To learn how to use the ‘Advanced’ person options to compare the heights of two or more people, each with a unique name and a specific silhouette from the library.
Tool Used: Height Comparison Chart
Steps involved for creating custom group comparison:
1: Open the Chart and Access the Advanced Options.
- First, you must navigate to the Height Comparison Chart, as this tool contains the necessary customization features.
- Next, click the “Add Person” button. A dialog box will appear. Inside this box, you should then click on the tab or link labeled “Advanced” to reveal all the customization options.
2: Customize and Add Your First Person.
Now you can begin creating your first custom person.
- A. Enter a Name: To begin, find the input field labeled “Name” and type the first person’s name, for example, “John Doe”.
- B. Input the Height: After that, enter John’s height into the feet and inches or centimeter fields. The tool is flexible, so you can use whichever unit you prefer.
- C. Select a Silhouette: Here is the creative part. Click the button that says “Choose Silhouette”. This action opens our extensive silhouette library. You can then scroll through various styles, such as people in casual clothes, business attire, or different poses. Select the one that best represents John.
- D. Add to Chart: Finally, click the main “Add Person” button at the bottom of the dialog box. As a result, you will see John’s silhouette appear on the chart with his name clearly displayed above it.
3: Customize and Add a Second Person.
- In order to create a comparison, you simply repeat the process for another person.
- First, click the “Add Person” button again and ensure you are in the “Advanced” tab.
- Next, enter the second person’s details. For instance, type the name “Jane Smith,” input her specific height, and then click “Choose Silhouette” to select a different style from the library that best fits her.
- Afterwards, click “Add Person.” Jane will now appear on the chart right next to John, each with their own custom name and look.
4: Continue Adding People to Form a Group.
- You can repeat Step 3 as many times as you need (Limits are applied for better visualization according to the devices). For example, you can add more family members, an entire sports team, or a group of friends. Each person can have their own unique name, height, and silhouette, consequently giving you a fully customized group lineup.
5: Analyze and Finalize Your Custom Chart.
- In the end, you will have a chart with multiple, distinct individuals, making the height difference easy to see and understand. You can click and drag each person to rearrange their order on the chart.
- Once you are happy with your custom group comparison, you can then use the “Download” button to save it as a high-quality image for your project, presentation, or personal records.

Tutorial 2: Compare Man-Made Marvels (Object to Object)
Goal: To visualize the incredible scale difference between two iconic structures, the Burj Khalifa and a Ferris Wheel.
Tool Used: Height Comparison Chart
- Step 1: Open the Correct Tool.
- First, you need to navigate to our Height Comparison Chart. This is the ideal tool because of its extensive library of famous figures and landmarks.
- Step 2: Add the First Structure.
- Next, click the “Add Figure” button. This action opens our figures library.
- You should then navigate to the “Famous Buildings” category. Inside, find and select the “Burj Khalifa”. As soon as you click it, the tool adds the skyscraper to your chart.
- Step 3: Add the Second Structure.
- Now, to create the comparison, you must click the “Add Figure” button once more.
- This time, look for a category like “Structures” or “Entertainment” and select the “Ferris Wheel”.
- Step 4: Analyze the Astounding Height Difference.
- Instantly, the chart places the Ferris Wheel next to the Burj Khalifa. Furthermore, the chart’s auto-scaling feature adjusts the view so you can see both objects in their entirety.
- Consequently, you can immediately and clearly comprehend the monumental difference in height between these two engineering marvels, something numbers alone could never convey.
Tutorial 3: Pro-Level Comparison (Your Real Image vs. a Celebrity)
Goal: To create a highly accurate and realistic height comparison between your own photo and a celebrity’s photo.
Tool Used: Real Image Height Comparison Tool
- Step 1: Prepare Your Images for a Flawless Result.
- Before you even open the tool, you must first prepare your images. This preparation is the single most important step for achieving a professional look.
- To begin, find a high-quality, full-body photograph of yourself standing straight. Then, find a similar photo of the celebrity.
- Crucially, you must crop both images closely on all four sides. This removes any unnecessary space. After that, use a free online background removal tool to make the background of each image transparent. You should then save them as PNG files.
- Step 2: Upload Your Prepared Image.
- Now, open the Real Image Height Comparison Tool.
- Click the “Images” button. You should then upload your prepared photo (the one without a background). Carefully enter your exact height into the height field and click the “Add Image” button.
- Step 3: Add the Celebrity’s Prepared Image.
- Next, you will repeat the process. Click the “Images” button again.
- Upload the celebrity’s prepared PNG file. You must then find their official height online and enter it accurately into the height field before clicking “Add Image”.
- Step 4: Admire Your Professional Comparison.
- Finally, you will see both you and the celebrity standing side-by-side on the chart. Because you prepared the images, the comparison looks clean, realistic, and seamless, without any distracting backgrounds. You can now download this high-quality comparison to share.
Tutorial 4: Comparing Rocky Planets and Moons
Goal: To use the tool to understand the subtle and significant size differences between neighboring celestial bodies like Earth, Mars, Venus, the Moon, and Mercury.
Tool Used: Planet Size Comparison Tool
- Step 1: Open the Cosmic Tool and Compare Earth vs. Mars.
- First, open the Planet Size Comparison Tool.
- Click the “Planet” button and select “Earth” from the library. Next, click the “Planet” button again and select “Mars”.
- You can now immediately visualize how much larger Earth’s diameter is compared to the Red Planet.
- Step 2: Clear the Chart for a New Comparison.
- After you have analyzed the first pair, you need to start fresh. To do this, simply click the “Clear All” button at the top of the chart. This instantly removes all objects.
- Step 3: Compare the “Twin” Planets: Earth vs. Venus.
- Now, with a clean chart, click the “Planet” button and add “Earth”. Then, click the “Planet” button once more and add “Venus”.
- As a result, you can see why they are often called “sister planets,” as their sizes are remarkably similar.
- Step 4: Clear Again and Compare the Smallest Bodies.
- Next, click the “Clear All” button one more time.
- This time, click the “Planet” button and select our “Moon”. Afterwards, click the “Planet” button again and select “Mercury”.
- This final comparison clearly illustrates that the planet Mercury is only slightly larger than Earth’s Moon, providing another valuable cosmic perspective.
Tutorial 5: Professional iPhone Lineup Comparison
Goal: To create a detailed visual comparison of iPhone evolution using both library models and custom images with advanced editing features.
Tool Used: iPhone Size Comparison Tool
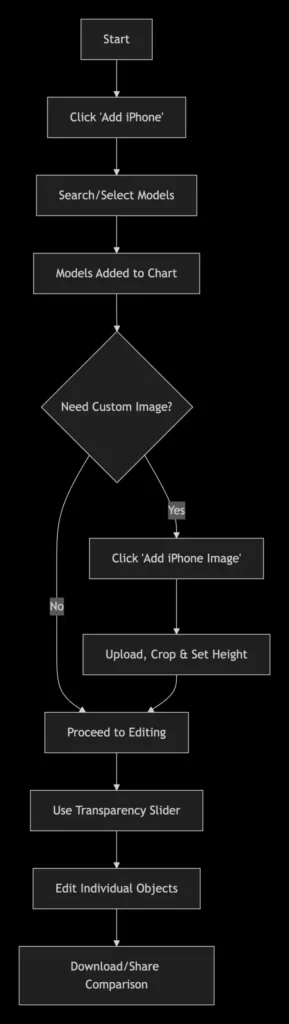
Steps for Professional iPhone Comparison:
1: Build Your Base iPhone Collection
First, navigate to the iPhone Size Comparison Tool and click the “Add iPhone” button. The library will display a random selection of models. As you hover over each iPhone, the model name will appear, helping you identify the right devices.
Pro Tip: Use the search bar at the top to instantly find specific models like “iPhone 15 Pro” or “iPhone 12 Mini”.
2: Add Custom iPhone Images (Optional)
For unique comparisons, click the “Add iPhone Image” button. Upload your own iPhone photo, then use our integrated cropper to precisely frame the device. Finally, enter the exact height measurement to ensure accurate scaling against library models.
3: Master Transparency for Clear Comparisons
When custom images overlap library models, use the Transparency Slider to adjust opacity. This allows you to see both images simultaneously, ensuring perfect alignment and height differentiation.
4: Advanced Object Customization
Click any iPhone on your chart to reveal the editing interface. Here you can:
- Rename devices for clear identification
- Adjust heights with real-time visual feedback
- Modify transparency for optimal overlay visibility
- Remove unwanted elements with the X button
5: Finalize and Export
Once satisfied with your lineup, use the “Download” button to export in HD PNG, JPG, or HD formats. Share directly to social media or save for professional presentations.
Tutorial 6: Cross-Brand Smartphone Analysis
Goal: To compare smartphones across different manufacturers and years using advanced filtering and customization features.
Tool Used: Phone Size Comparison Tool
Steps for Cross-Brand Analysis:
1: Navigate the Smartphone Library
Open the Phone Size Comparison Tool and click “Add Phone”. The library is organized by Brand categories (Samsung, Google, Apple, etc.) with Year subcategories (2023, 2024, 2025, etc.). This hierarchical structure helps you quickly locate specific device generations.
2: Efficient Device Selection
- Category Navigation: First select your brand, then filter by release year
- Hover Identification: Mouse over any phone to see the full model name
- Quick Search: Use the search bar for direct model access across all brands
3: Add Custom Phone Images
Click “Add Phone Image” to upload photos of devices not in our library. After cropping and setting the height, use the Transparency Slider to compare your image against official models.
4: Professional Editing Workflow
Select any phone on your chart to access the full editing suite:
- Change names for clear comparison labels
- Adjust heights if you have more precise measurements
- Modify colors (where available) for better visual distinction
- Control transparency for overlapping elements
5: Create Comprehensive Comparisons
Add multiple devices from different brands and years to analyze design evolution. The chart automatically scales to show all phones clearly, while manual zoom allows detailed inspection of specific features.
Tutorial 7: Scientific Height Prediction & Visualization
Goal: To generate accurate adult height predictions and create visual comparisons showing the child alongside parents at predicted height.
Tool Used: Child Height Calculator & Predictor
Steps for Height Prediction & Visualization:
1: Input Accurate Data
Navigate to the Child Height Calculator and carefully complete all form fields:
- Child’s current age, height, and weight
- Parental heights (both mother and father)
- Child’s gender for appropriate growth models
Accuracy Tip: Use recent measurements and ensure all units are consistent for the most reliable prediction.
2: Generate Scientific Prediction
Click the “Calculate Height” button to process your data through our regression-based growth model. The system analyzes multiple variables to provide a statistically sound prediction.
3: Interpret the Results
The tool displays:
- Numerical Prediction: The estimated adult height in both metric and imperial units
- Growth Chart Visualization: A percentile-based growth curve showing the child’s current position and projected trajectory
4: Create Family Height Comparison Chart
From the results page, you can visualize the prediction by creating a height comparison chart showing:
- The child at predicted adult height
- Both parents at their actual heights
- Optional: Siblings or other family members for context
5: Download and Share Visualization
Once your family height comparison chart is ready:
- Download as high-quality PNG or JPG
- Share directly to social media platforms
- Use the transparency feature to create clean, professional visuals
The visual chart makes it easy to see how the child’s predicted height compares to parents, creating a meaningful family growth perspective that’s perfect for sharing and tracking over time.